Streamlined Energy has developed it's own solution to the problems associated with gathering and reporting on energy consumption within organisations. There are three elements to our solution: the mobile app, back-end processing and the reporting system.
Our unique in-house-developed app dramatically reduces the time taken to capture meter reading data. We supply clients with QR codes that are then attached to meters. When the meter is read, all that is required is to scan the code and take a photo of the display. The process literally takes seconds.
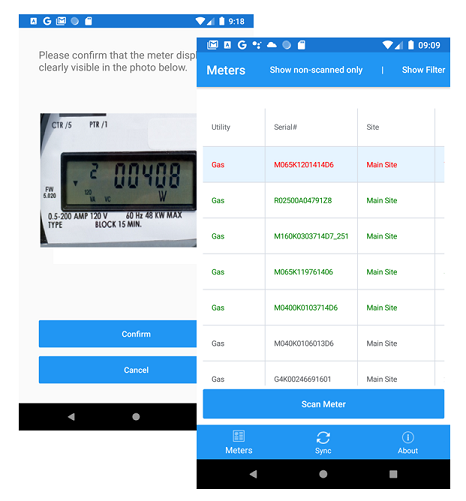
Before starting a meter reading run, a user will perform a 'Sync Download' in the app. This process downloads the latest meter & reading data to the mobile device. The user will then typically visit all the meters in the order they are displayed in the list. Taking a reading consists of scanning the meter's QR code to identify the meter and then taking a photo of the display. As the meters are processed, they turn green so the user can see how they are progressing. When all the meters have been processed, a 'Sync Upload' is performed. All the photos will then be uploaded to our server.
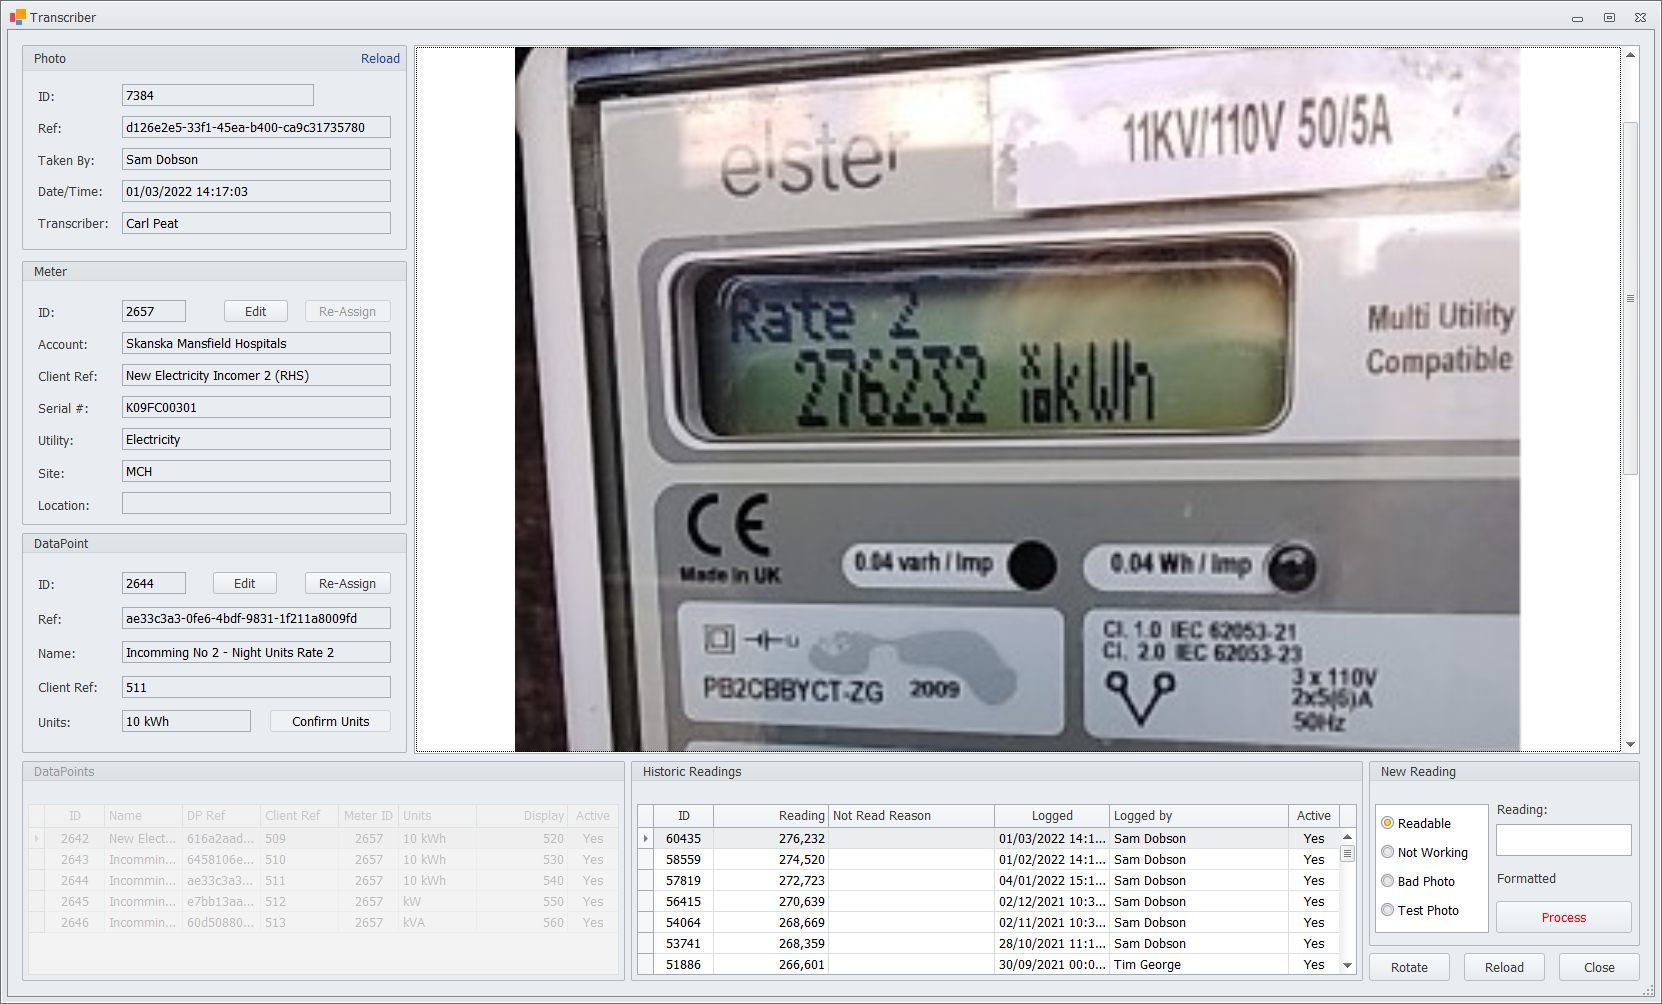
Once the photos have been uploaded to our server, they meter readings are then extracted using a combination of OCR processing and manual verification using our in-house admin tool. All data is validated against historic readings to eliminate erroneous values. Once processing is complete, the readings are then exported to the client's nominated recipients in the form of csv or spreadsheet attachments. In addition, the data can also be uploaded to our in-house reporting system and/or a third-party reporting system (Systems Link, eSight etc).
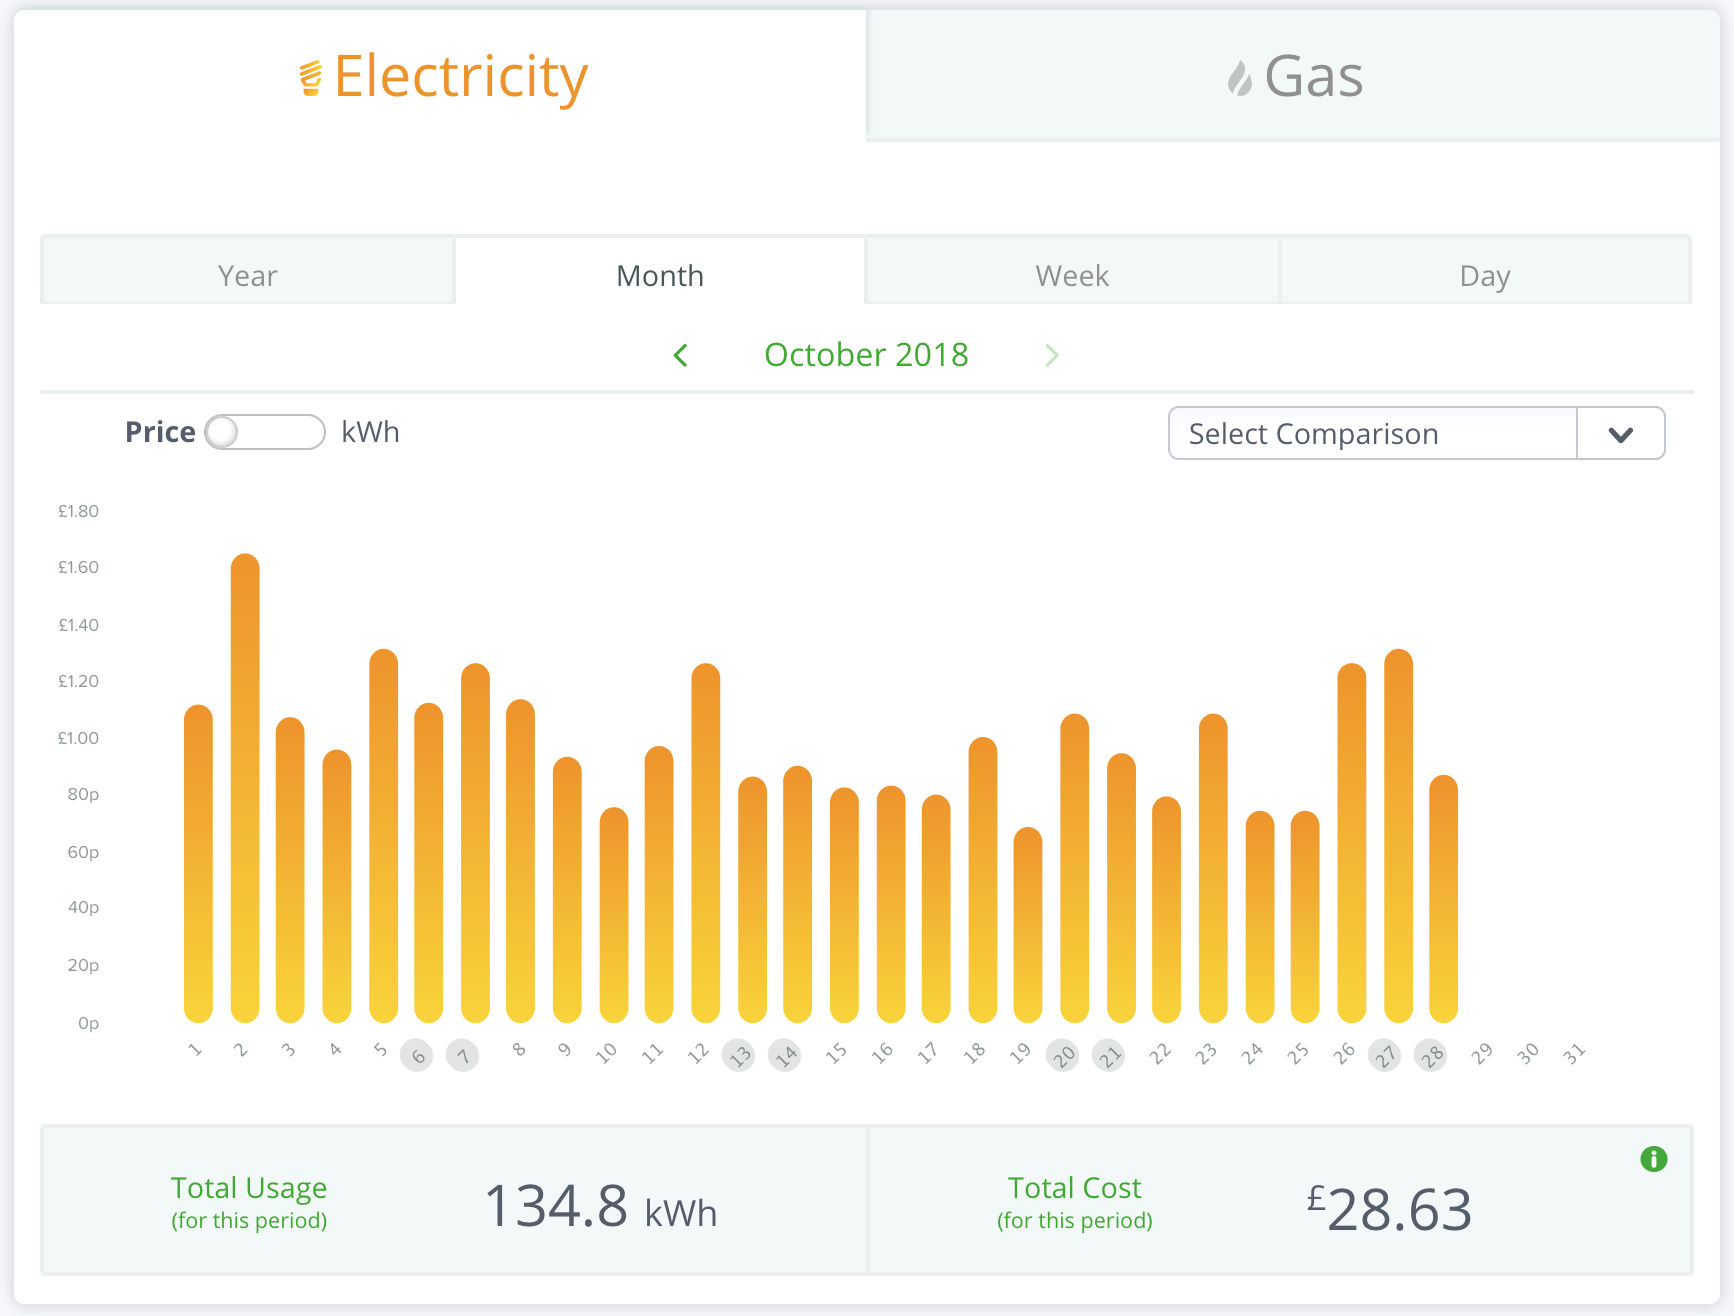
Our energy reporting system is a web-based tool that allows users to drill into their consumption data and provides insights into where energy/carbon/money is being used thus facilitating remedial decisions and actions. The graphical nature of the reporting highlights exactly where issues exist.
“Streamlined Energy is such an improvement on how things used to be done!”– Senior Energy Officer at NHS
“Streamlined Energy has been an absolute godsend! Now I can see exactly what is going on.” - FM Company PFI Hospital
